Have you thought about the many layers of measuring and monitoring within your Quality Management System? Let’s take some time to describe this space and see how measuring and monitoring drives continuous improvement and quality.
Introduction
In the previous article of this series, we explored process mapping as a methodology that provides visibility into processes and enables revealing capacity bottlenecks, poor handoffs, and process overlaps, but also enables determining where measures are needed to monitor process performance and drive continuous improvement.
In this article, we will travel through the measuring and monitoring of quality processes within a Quality Management System (QMS) and offer responses to the most common questions in this space. With the end goal of using metrics and Key Performance Indicators (KPIs) to facilitate the evaluation of the suitability and effectiveness of a QMS, we will move from exploring the general, theoretical concepts underpinning metrics & KPIs to the specific, drilling down into real-world examples.
The Importance of KPIs Within the QMS
The notion of continuous improvement implicitly includes the one of measuring and monitoring; in other words, there is no continuous improvement where there is no measuring and monitoring, and when it comes to measuring and monitoring, metrics and key performance indicators are at the very core of it.
In fact, to demonstrate that a process within the Quality Management System (QMS) is suitable and effective and delivers on its objectives, organizations need to have evidence (data) to support their evaluation and decision-making towards where there are opportunities for improvement that is where the evidence shows that the process does not perform as expected.
The concept itself is straightforward, but its implementation demands organizations to possess a certain level of maturity. This includes the ability to clearly define their key processes, identify which aspects of these processes require measurement, establish the methods and frequency of measurement, and determine when to analyze and evaluate the outcomes of these measurements, typically during operational meetings or as part of their Management Review process.
Moreover, KPIs need to tell the organization something meaningful and actionable to justify the effort of tracking them; in most cases, a flat line of measures does not provide any meaningful information besides that the specific metric remains constant over time. However, also the choice of the scale of measure has its relevance, it can transform a seemingly flat line of data into meaningful information by revealing patterns or trends that would otherwise remain hidden – typical example is measuring number of complaints in ppm per units sold instead of in percentage.
The idea is not to measure all activities described in the QMS but to determine which activities are crucial to be measured and monitored, as they are the ones that impact the delivery of the QMS objectives and the organization’s goals the most.
What do we Mean When We Say Monitoring and Measuring?
Before going forward, let’s take a step back and clarify what measuring and monitoring mean. The two words are by intent used jointly, as when it comes to metrics and KPIs, they only make sense together. As per the ISO 9000:2015 definitions, measuring is the process of determining a value, and generally, this is the value of a quantity – which also means that what you measure should be quantifiable. In contrast, monitoring determines the status of a process or an activity at different times. Finally, the measures collected over time through monitoring are the evidence that enables decision-making and facilitates continuous improvement.
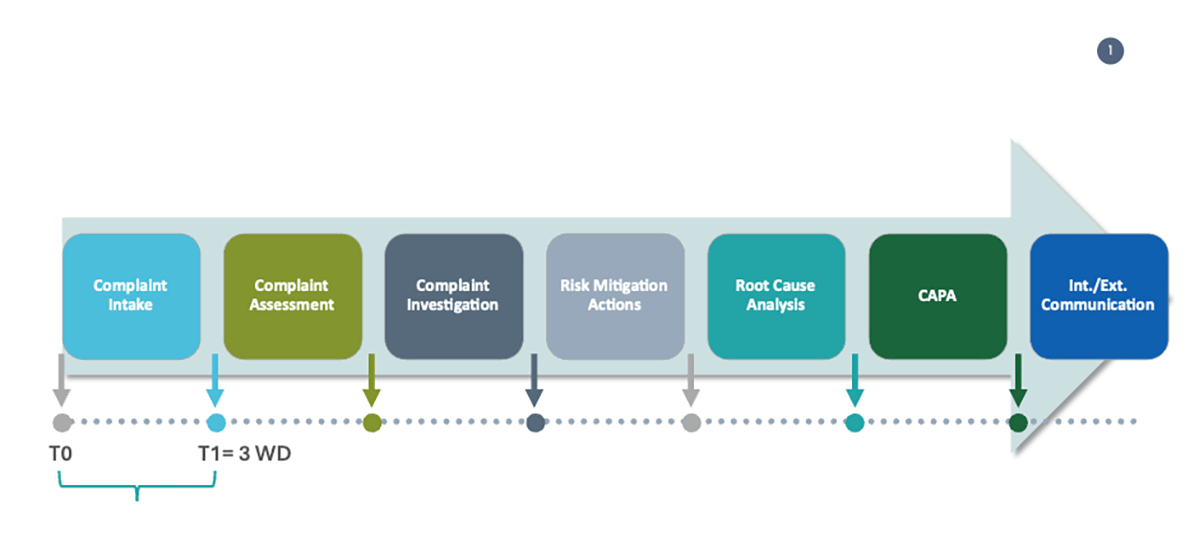
A practical example: measuring for multiple instances the time used to perform an activity, such as complaint intake, against a defined target – within three working days from receipt – allows monitoring if the underlying process, complaint management, performs as expected and where there are opportunities for continuous improvement.
What is the difference between Metrics and KPIs?
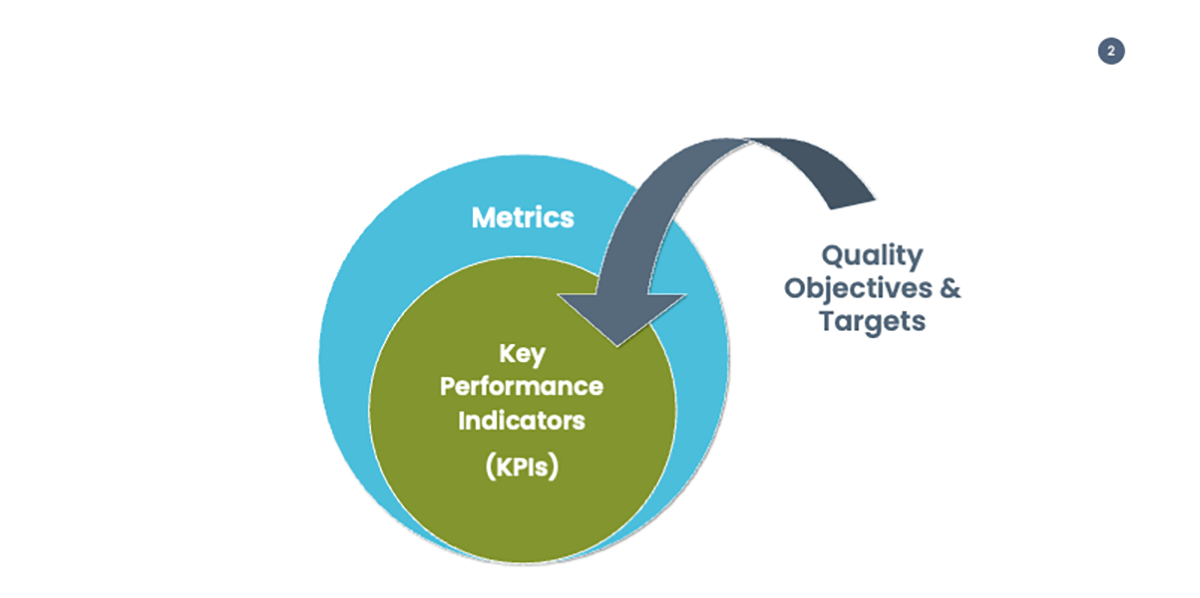
So far, I have used the words metric and KPI almost interchangeably; however, they are so only to a certain extent. Simply put, a metric is a measure of the status of a process; it can consist of one data, or it can be obtained by calculation from a set of data. Key performance indicators are a subset of metrics, which are defined based on the objectives the organization wants to achieve and the targets associated with those objectives. They measure the status of a process versus a defined target. All KPIs are metrics but not the vice versa. The KPIs sit in the universe of metrics.
Let’s consider the previous example; one of the objectives of a QMS is ensuring that complaints are timely investigated, and let’s say that an organization has defined the objective of improving by 5% its complaints timeliness by the end of the year versus the previous year baseline, accordingly:
- Objective: Improve complaints timeliness
- Target: improve by 5% complaint timeliness by the end of the year
- KPI: month-by-month cumulative on-time closure rate
- Metrics: percentage of complaints timely investigated, number of complaints to be closed in the month, number of complaints closed on time in the month
According to the above, a company with a mature monitoring framework, generally has a good number of metrics that uses for monitoring execution of their key processes, with selected KPIs for monitoring progresses in achieving the company objectives.
Benefits of a Rich Catalogue of Metrics and how they Support the Quality Strategy
From my personal experience, the foundation of a robust and agile monitoring framework is a rich catalogue of metrics that is revised annually as part of the quality strategy/objectives lifecycle. When the quality strategy is defined along with the quality objectives, the company can select from the catalogue the subset of metrics that will be elevated to key performance indicators for monitoring progress in achieving the quality objectives.
The key metrics’ characteristics to be included in the catalogue are:
- name of the metric
- short definition
- scope
- calculation method
- data source
- frequency of measurement
Leading Indicators Prompt Change and Lagging Indicators Inform of the Past
When discussing KPIs, it is a must to introduce Lagging and Leading indicators and the difference between them.
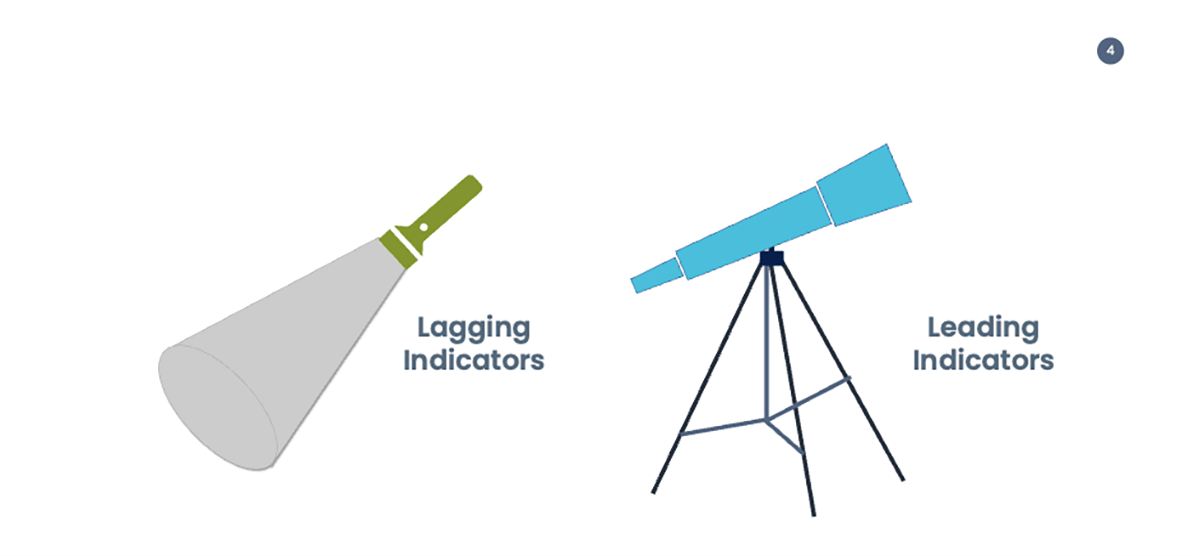
The easiest way to differentiate leading and lagging indicators is that lagging indicators are looking back to something that has already happened; they essentially measure the current performance, whereas leading indicators are forward-looking, and they predict the future performance.
Clearly, there is no certainty about the future; however, where the prediction is not landing where you should be to achieve the objective, it opens an opportunity to adjust before it happens, which means that the leading indicator is a metric that can prompt change. In contrast, a lagging indicator can only inform you of what happened.
In general, leading indicators are more difficult to define as they require identifying a linkage between two measures, a cause-effect relationship, where the change in one measure (leading) triggers the other one to start to change (lagging).
Let’s see a concrete example in the context of deviation management. A leading indicator for a low number of repeat deviations might be the number of training hours delivered to the organization on root cause analysis (RCA) (the metric that triggers the change). Increasing capability in RCA through training is expected to determine the true or most probable root cause of a deviation and, therefore, to define adequate CAPA, which reduces the number of repeat deviations (a metric that starts to change and targeted future performance). Where there is no visible reduction in repeat deviations, the content or training methodology can be adjusted to deliver the expected reduction.
Another way to come up with a leading indicator is to answer the question “what leads to the specific result in performance?”
Let’s see another example responding to the question: what leads to reduced recalls (targeted future performance)?
The number of process assessments or improvements could be used as a leading indicator for recalls; by identifying and addressing weaknesses in processes, companies can reduce the likelihood of future recalls.
These two examples are also very relevant to show that indicators can also be lagging or leading depending on what you want to measure or how you look at them.
Back to the examples above, where you measure the training hours delivered in relation to the increasing capability in RCA, the indicator is leading (forward-looking) as it predicts future performance (low number of repeat deviations). However, where you do it with the intent of measuring the performance of the training team – how many training hours have been delivered by the team – the indicator is lagging (looking back) as it informs you about something that has already happened.
Similarly, where you measure the number of improvements in relation to the reduction of recalls, the indicator is leading; however, where you do it to measure improvements implemented for a specific product or process, the indicator is lagging.
In summary, leading indicators predict future performance through a cause-effect relationship with a second indicator or metric. They prompt change; where the “effect” (future performance) is not landing towards the target, what is being measured can be adjusted to deliver the targeted performance. They are more strategic than lagging indicators because they measure factors that directly contribute to achieving long-term objectives and allow adjusting the strategy depending on the actual performance/result. Here, we can see again the importance of a rich catalogue of metrics, including leading indicators.
Lagging indicators tell what happens, inform about past performance, do not prompt change to adjust the performance, and are final. They still are very informative, and many organizations monitoring frameworks rely essentially only on lagging indicators, as they provide signals in the form of trends or peaks arising from a series of time points – again, flat lines are often not meaningful – and where those signals require investigation to determine their root cause and to define actions to correct it. Understanding past performance promotes informed decision-making to improve future performance.
What Makes a Good Indicator?
Another question often prompted in the KPIs space is whether there is anything like a good or bad indicator. While we can list several characteristics from 20+ years of experience in the pharma industry, above all, three factors determine the quality of an indicator: quantifiability, meaningfulness, and actionability. A good indicator should be quantifiable, and therefore, it can be measured; it should provide meaningful information to help stakeholders determine whether the process being measured is suitable, effective, and efficient in achieving its objectives, and it should be actionable in the sense that stakeholders know how to interpret the results and what actions to take based on them.
It is worth mentioning that a good indicator should foster the right behaviours. This last characteristic calls for several considerations, taking too much space here. More to come on this.
The Monitoring Framework and Associated Dashboard
Coming back to the monitoring framework, both types of indicators are necessary for measuring and monitoring and for articulating the organization’s objectives and targets. A robust monitoring framework includes the insight obtained by looking back at past performance (lagging indicators) and forward-looking to the targeted future performance (leading indicators).
In its essence and in the context of a QMS, a monitoring framework aims to ensure adequacy and state of control of processes and promote their continuous improvement, focusing not only on the effectiveness of the QMS but also on its efficiency.
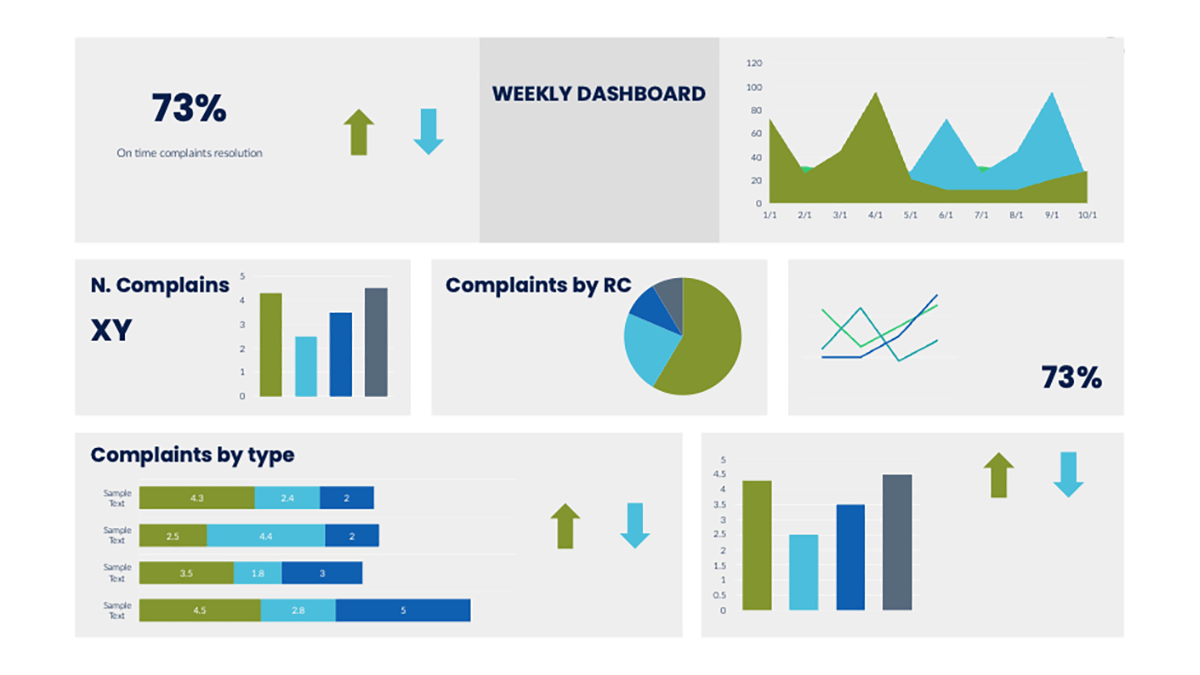
Dashboards built on the monitoring framework are an essential tool for continued communication of performance. The dashboards get the organization engaged and accountable for continuous improvement. The visualization of performance data over time that dashboards offer is a powerful tool that can immediately gauge commitment and promote accountability to get better across an organization.
Conclusions:
In conclusion, through the determination of their key processes, what in their key processes needs to be measured and through the implementation of a robust monitoring framework, pharma companies can track progress towards strategic quality objectives, evaluate the suitability, effectiveness, and efficiency of their QMS and identify areas for continuous improvement. Moreover, the ability to monitor performance through meaningful metrics is also essential for maintaining the trust of competent Health Authorities by showcasing strong knowledge and control over critical activities.
Insight on the meaning of the metrics and KPIs and knowledge on interpreting the results is of utmost importance and should be nurtured across the organization. Too often, the focus is on achieving a target without examining how the target has been achieved, is on showing a polished surface, disregarding what is underneath. Internal audits provide a view into how the target has been achieved, into what lies underneath, and where actions are necessary. We will explore internal audits and how they contribute to continuous improvement in greater detail in the next article. Watch this space!
Links
The Campbell Institute – Practical Guide to Leading Indicators
ISO 9001:2015 – Quality management systems — Requirements
ISO 9000:2015, Quality management systems — Fundamentals and vocabulary
ICH Q10 Pharmaceutical Quality System
KVALITO is a strategic partner, global quality and compliance service, and network for regulated industries. To find out more, please visit us at www.kvalito.ch. If you want to benefit from KVALITO’s expert services, please email us at contact@kvalito.ch. Are you looking for an exciting and challenging position as a consultant, or are you an ambitious student/graduate looking for an internship? Please send your complete application to recruiting@kvalito.ch.


