In our ongoing exploration of the interconnected web of quality processes within a QMS, we shift our attention from previously discussed methodologies to a pivotal focus on process mapping and analysis. These practices serve as the fact-based bedrock essential for optimizing processes, ensuring better alignment of workflows with customer needs and broader business objectives. This methodology stands as a vital driver for the continuous improvement of both business and quality processes within quality management systems.
What is Process Mapping?
Process mapping is a technique that visually depicts the sequence of steps, inputs, outputs, and other elements comprising a business process. It is often created in flowchart or diagram format.
Process maps provide a mutual understanding of processes and enable analysis of the current state; analysis involves thoroughly reviewing the mapped workflow to identify opportunities for improvement.
Process maps can be used in various situations, directly or indirectly, aiming for continuous improvement, such as problem-solving and root cause analysis, auditing, and inspections, or when building a learning experience for personnel qualification. Process mapping and analysis is a paramount methodology for quality management because it provides visibility into processes and enables data-driven improvement.
By documenting a process flow in detail, ambiguities and inconsistencies become apparent, offering opportunities for standardization and alignment with guidelines. It identifies where measures are needed to monitor process performance, revealing capacity bottlenecks, decision complexities, lack of compliance, poor handoffs, and driving targeted solutions.
Improved processes will lead to reduced defects and increased customer satisfaction. Process mapping and analysis also facilitate consistency in the execution of processes by showing employees their role in the flow.
Effective quality management requires an in-depth understanding of processes focusing on continuous improvement. Process mapping and analysis provide the foundation for optimizing quality across operations.
How to Perform Process Mapping
The mapping of a process can be broken down into six key steps.
The best approach is to arrange a brown paper workshop with SMEs (Subject Matter Experts) on the process to be mapped and with end users covering the different roles within the process. The more interactive process mapping is, the more insight there is into where there are opportunities for continuous improvement.
- Define Scope and Gather Information
- Determine the specific process to be mapped and set mapping goals.
- Interview process owners and employees. Observe workflow. Review documents.
- Map Process Flow
- Document all process steps from start to finish, including decision points.
- Capture roles, cycle times, systems used, inputs, and outputs.
- Insert Flow Symbols and Data
- Use standard flowchart symbols to depict workflow.
- Add relevant data like time, cost, defects, and volumes throughout the map.
- Validate and Refine
- Review the process map with employees to confirm accuracy.
- Refine the map based on feedback.
- Analyze the Process
- Identify waste, bottlenecks, redundancies, delays, and root causes.
- Evaluate value-added vs. non-value-added steps.
- Redesign and Optimize
- Develop an improved future state process map.
- Drive process changes to increase efficiency, quality, and flow.
Different Process Mapping Maps
There are many types of process mapping maps; for the overview graph below, seven different graphs are shown as Process Flow Diagrams, and each of them represents other production processes, starting from Customer order, Production plan, Manufacturing, Shipping and Delivery; some of them belong to several processes.
The type of process map used hinges on the specific needs and goals for modelling and analyzing a given process. A combination of maps is commonly used to provide different perspectives and dive into the different parts of the process. The choice of process map type used hinges on specific requirements and objectives for modelling and analyzing a particular process. Often, a combination of maps is employed to offer diverse perspectives and delve into various aspects of the process in greater detail
- The Process Flow Diagram is a high-level overview of a process, showing the general workflow and critical steps and delineating the entire order-to-delivery process. It encapsulates various perspectives and stages, providing a panoramic understanding of the sequence. By intricately charting these steps, the map offers a detailed insight into the process, ensuring efficient delivery to the customer.
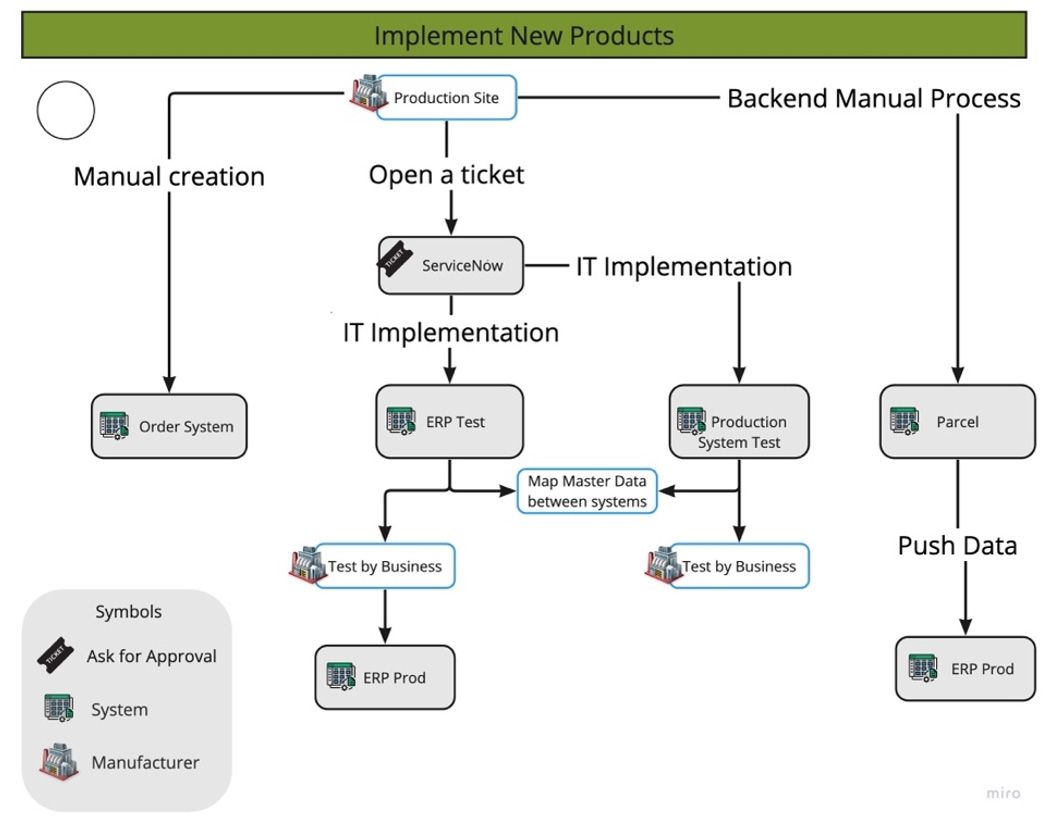
- Flowcharts and Business Process Models (BPMN): Flowcharts employ standardized symbols to illustrate the sequence of process steps, decisions, and connections, offering a clear visualization of the entire workflow. When applied to ordering or managing customer orders, a specific procedural flow is essential for implementing a new product seamlessly. To represent these processes, the (BPMN) serves as a standardized methodology, allowing for the visualization of intricate processes. BPMN encompasses decisions, loops, parallel tasks, and events, enabling a comprehensive and structured representation of the steps involved in managing and fulfilling customer orders within the context of introducing a new product.
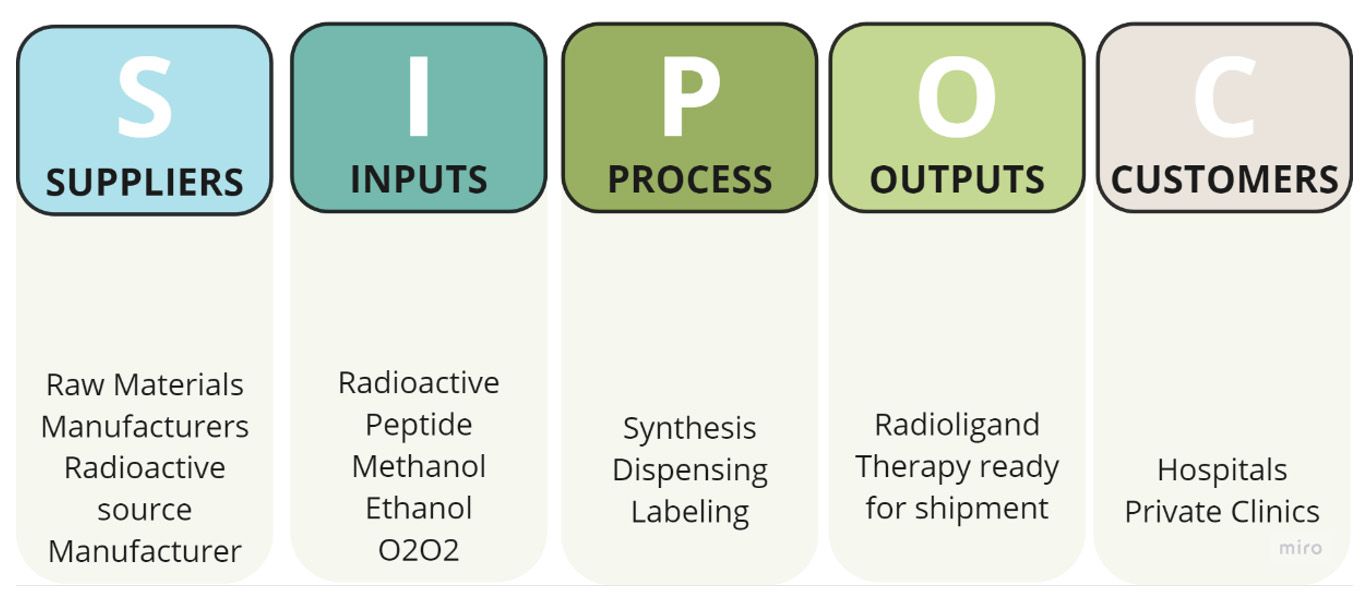
- SIPOC diagrams are structured representations that delineate the Suppliers, Inputs, Processes, Outputs, and Customers, providing an overview of high-level process components. In the context of sourcing radioactive products for hospitals or clinics, as in the context below, these diagrams serve as a valuable tool to map out and understand the critical elements involved in the procurement process. By outlining the suppliers of radioactive products, the various inputs needed, the processes involved in procurement, the resulting outputs, and ultimately, the end-users, these diagrams offer a comprehensive understanding of the complex sourcing process for radioactive materials within healthcare facilities.
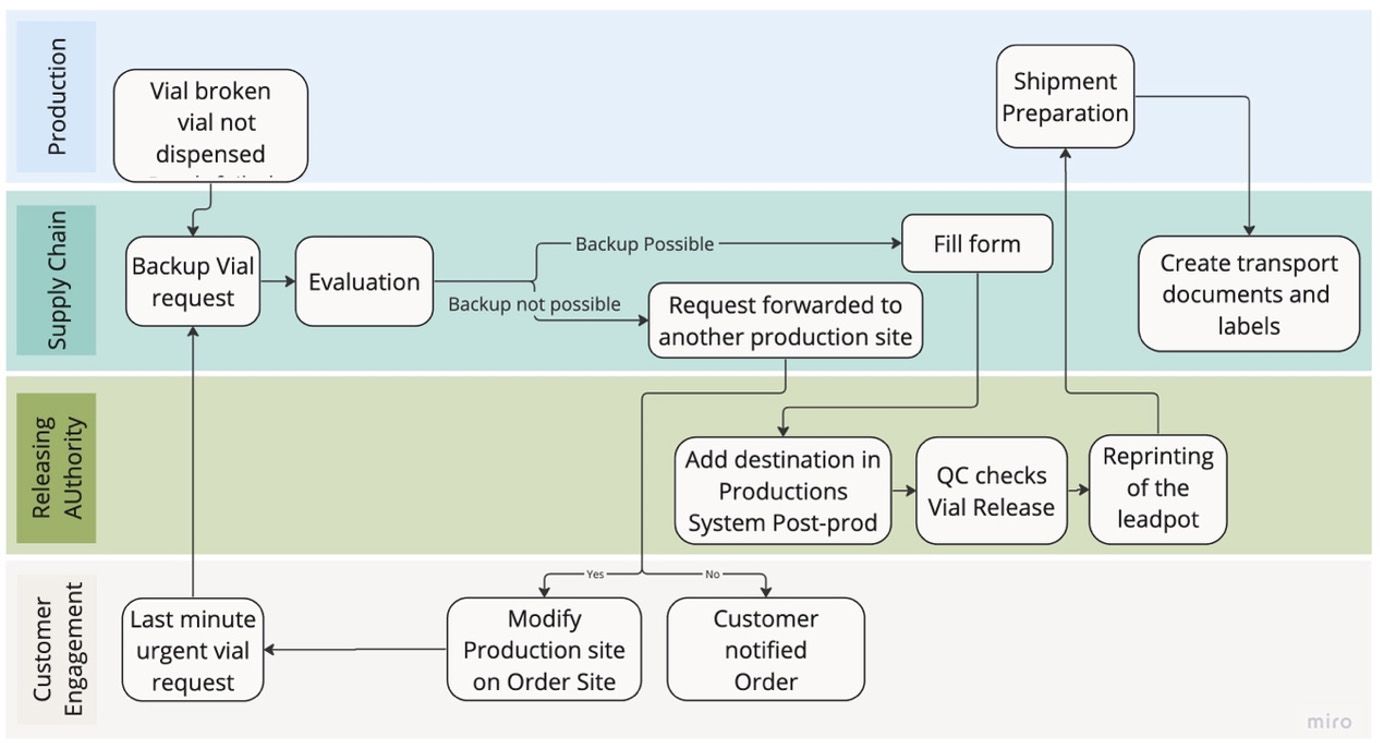
- The swimlane diagram outlines process steps by segregating them into distinct horizontal ‘swim lanes,’ each denoting different departments or roles. This visual representation effectively clarifies responsibilities. In this context, the diagram details the procedural pathway to address compliance issues arising from a missing vial during production.
- Value stream maps combine process flow, information flows, and data life cycle times. They help identify waste and streamline processes. In this example, the value stream relates to the product production cycle, from area preparation to dispensing the final product. Notable checkpoints are integrated into the process, including pre-production verification and an additional checkpoint post-Quality Control (QC) before the dispensing phase.
- The Gantt Chart illustrates the developmental stages of a new product roadmap, providing a visual breakdown of tasks, their durations, and interdependencies over time. In product development, a Gantt chart visually maps out tasks such as research, design, testing, and launch, allowing teams to track progress, allocate resources, and efficiently manage dependencies throughout the product development lifecycle.
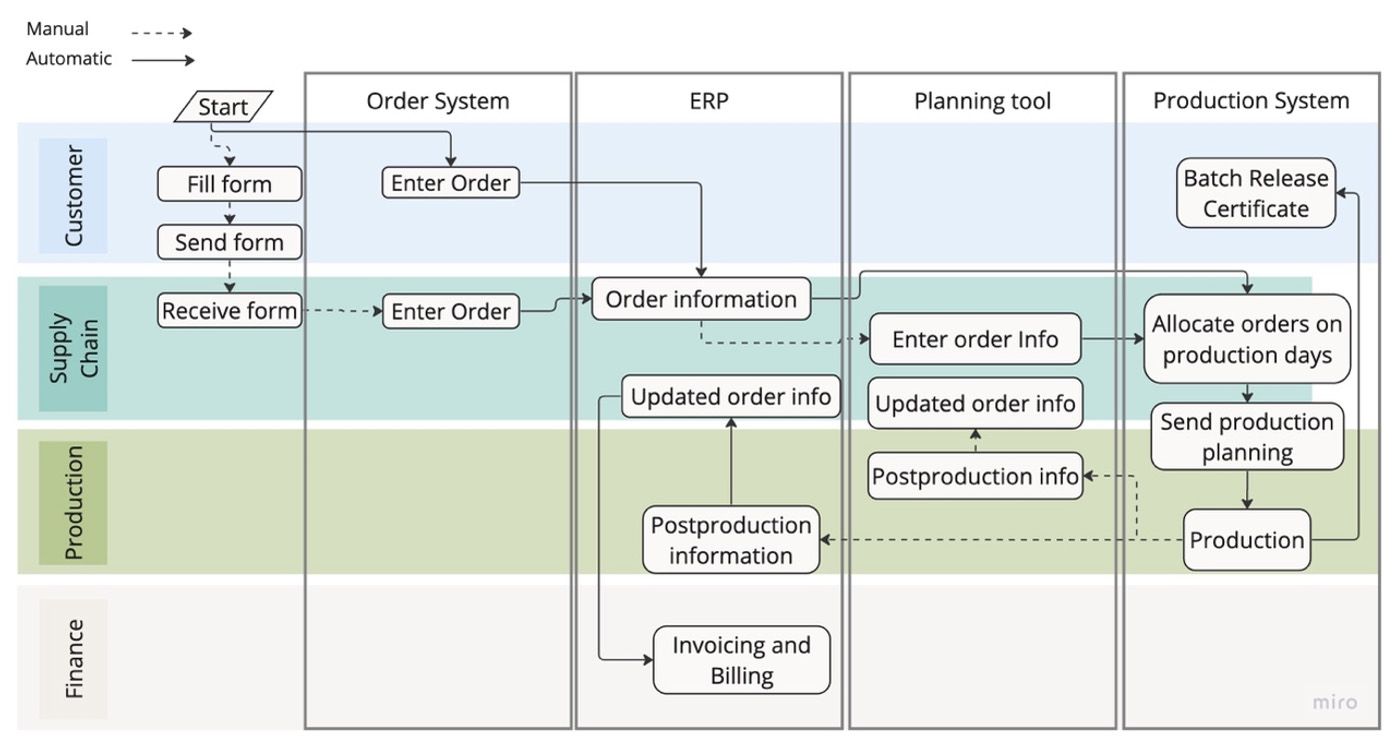
- Workflow diagrams illustrate the flow of documents and information among individuals, departments, and systems, emphasizing handoffs. In the case of a complete order flow from customer to post-delivery billing, identifying areas already automated can serve as a target for further automation or digitalization.
Mapping Analysis
Once the process is mapped, the core activity that will identify where there are opportunities for improvement is the mapping analysis.
There are typical and recognizable steps for analyzing a process map:
- Review Process Inputs/Outputs to ensure alignment with business needs and customer requirements.
- Identifying value-added vs. non-value-added steps consists of assessing which process steps contribute value.
- Analyze Metrics and Data, including examining cycle times, defects, costs, resource utilization, and other metrics to identify issues.
- Pinpoint Waste and Inefficiencies by targeting any wait times, bottlenecks, redundancies, or delays to remove them.
- Assess Decision Points and Automation to simplify complex decisions and evaluate possible automation opportunities.
Finally, considering all the elements collected, the process can be redesigned, and changes can be implemented by:
- Developing future state process maps to optimize flow, efficiency, and quality.
- Prioritizing and rolling out process changes.
- Continually gathering data to monitor performance and identify new areas for improvement.
Conclusion
Simplifying decision points and streamlining handoffs to minimize delays should be a priority. Leveraging technology like automation and optimized workflows can significantly boost both speed and accuracy in operations.
An integral consideration remains the redesigning of processes to maintain compliance with ever-evolving guidelines. By incorporating metrics and controls into proactive monitoring, we can continually assess process performance. Addressing underlying issues might involve refining training programs and procedures, clarifying roles and responsibilities, and upgrading equipment and systems for improved overall capabilities.
When focusing on customer-centric process changes, the goal is to directly enhance value, quality, and satisfaction. Even a few key improvements within a process often lead to substantial increases in speed, quality, consistency, and cost-effectiveness. Implementing process mapping and analysis as a best practice allows for a comprehensive understanding before optimizing design, where the future state process map serves as the blueprint for implementation.
In the realm of Quality Management Systems (QMS) and continuous improvement, Key Performance Indicators (KPIs) take center stage. These pivotal metrics act as guiding compasses for organizations, enabling the tracking of progress and identification of areas primed for enhancement.
Establishing and measuring KPIs is a strategic endeavor requiring meticulous metric selection, realistic target setting, and robust measurement methods. Coupled with effective monitoring and reporting practices, this approach facilitates early identification of deviations, fosters transparency, and supports informed decision-making.
Our upcoming article is poised to delve deeper into this realm, exploring the techniques of establishing, measuring, and optimizing KPIs within a QMS. Uncovered by our exploration of Quality Management Systems (QMS) and Key Performance Indicators (KPIs) within life sciences, it’s evident that a commitment to excellence is non-negotiable. This journey toward elevated quality and efficacy requires actionable insights. Embracing these principles is a step toward unlocking your business’s true potential. Reach out for guidance on optimizing your QMS—let’s embark on this quest for excellence together.
Image by <a href=”https://www.freepik.com/free-photo/pins-threads-vintage-map_7725676.htm#from_view=detail_serie”>Freepik</a>
https://www.freepik.com/free-photo/pins-threads-vintage-map_7725676.htm#from_view=detail_serie
KVALITO is a strategic partner, global quality and compliance service, and network for regulated industries. To find out more, please visit us at www.kvalito.ch. If you want to benefit from KVALITO’s expert services, please email us at contact@kvalito.ch. Are you looking for an exciting and challenging position as a consultant, or are you an ambitious student/graduate looking for an internship? Please send your complete application to recruiting@kvalito.ch.


